Key performance indicators
Total return (% on opening NAV)
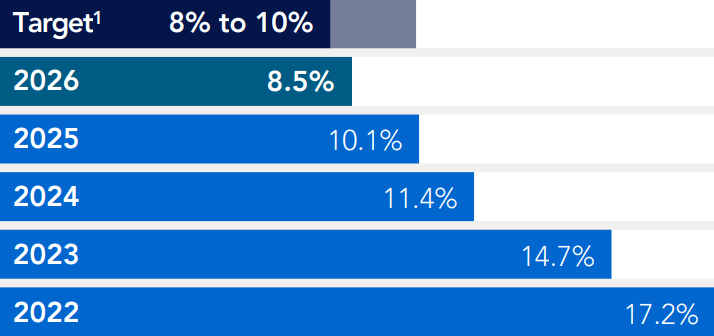
Target
To provide shareholders with a total return of 8% to 10% per annum, to be achieved over the medium term.
Outcome for the year
Total return of 8.5% for the year to 31 March 2026.
Performance against target
Met or exceeded target for 2026 and every prior year shown.
Rationale, definition and performance over the year
Rationale and definition
- Total return is how we measure the overall financial performance of the Company
- Total return comprises the investment return from the portfolio and income from any cash balances, net of management and performance fees and operating and finance costs. It also includes foreign exchange movement and movement in the fair value of derivatives and taxes
- Total return, measured as a percentage, is calculated against the opening NAV, net of the final dividend for the previous year, and adjusted (on a time-weighted average basis) to take into account any equity issued and capital returned in the year
Performance over the year
- Total return of £295 million in the year, or 8.5% on opening NAV
- A key driver of the total return was generated from the sale of TCR
- The portfolio showed good resilience overall with strong performance in particular from Oystercatcher, Future Biogas, Tampnet and FLAG
- The performance of SRL and write-down of DNS:NET detracted from the portfolio return
- The hedging programme continues to reduce the volatility in NAV from exchange rate movements
- Costs were managed in line with expectations
As at 31 March 2026
Annual distribution
pence per share
Target
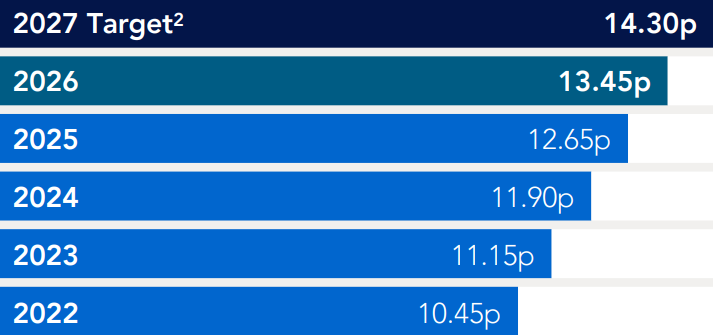
Progressive dividend per share policy. FY27 dividend target of 14.30 pence per share.
Outcome for the year
Total dividend of 13.45 pence per share paid and proposed.
Performance against target
Dividend per share increased every year since IPO.
Rationale, definition and performance over the year
Rationale and definition
- This measure reflects the dividends distributed to shareholders each year
- The Company’s business model is to generate returns from portfolio income and capital returns (through value growth and realised capital profits). Income, other portfolio company cash distributions and realised capital profits generated are used to meet the operating costs of the Company and to make distributions to shareholders
- The dividend is measured on a pence per share basis, and is targeted to be progressive
Performance over the year
- Proposed total dividend of 13.45 pence per share, or £124 million, is in line with the target set at the beginning of the year
- Income generated from the portfolio and cash deposits, including non-income cash distributions and other income from portfolio companies, totalled £208 million for the year
- Operating costs and finance costs totalled £75 million in the year
- Total income and non-income cash less operating and finance costs totalled £133 million and therefore the dividend was fully covered for the year with a surplus of £9 million
- Setting a total dividend target for FY27 of 14.30 pence per share, 6.3% higher than for FY26
As at 31 March 2026

TCR
How we grew a European champion into a global platform, delivering a 3.6x money multiple on exit.

Investor Meet Company
CFO James Dawes presents 3iN’s Full-year results, including the successful exit of TCR and the new investment in Lefdal Mine Datacenter.
Latest results

Connecting continents
Our portfolio company FLAG is one of the world’s largest private subsea fibre optic networks, connecting more than 40 countries across four continents. Find out how.
